Wij zijn Link Jongerenwerk.
Middenin de samenleving
In een wereld vol uitdagingen en complexe problemen staan wij onverschrokken aan de zijde van de jongeren.
Wij zijn Link. Een organisatie met jongerenwerk als expertise. Wij begrijpen de unieke obstakels waarmee jongeren van tegenwoordig geconfronteerd worden en vechten met passie en vastberadenheid voor een betere toekomst.
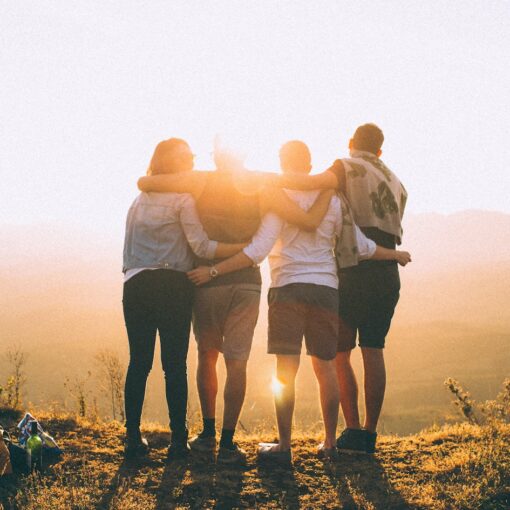
Link staat voor verbinding. Want samen staan we sterker. We stappen op jongeren af en vragen vanuit oprechte interesse naar hun verhaal. We kennen de wijken, de scholen, de ondernemers en de zorgaanbieders. Als we er samen niet uit komen, weten we wie ons verder kan helpen. Want niemand staat er alleen voor.
- Outreachend jongerenwerk
- Jongerenwerk op school
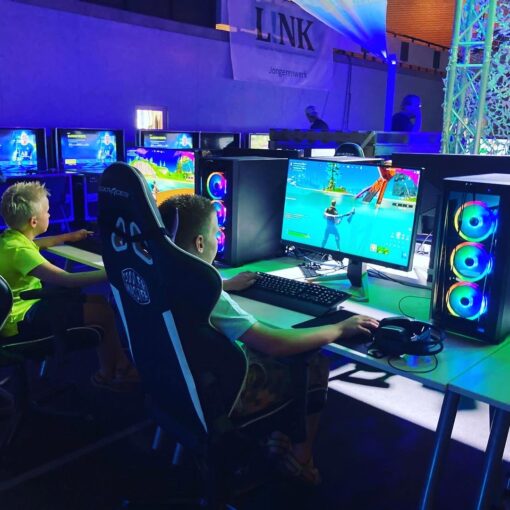
- Innovatieve projecten
- Jongerencoaching
- Link Preventie

“Ik voelde me leeg, somber en onbegrepen en wilde zelfs suïcide plegen. Toen leerde ik op straat een outreachend jongerenwerker kennen. Hij heeft mijn verhaal aangehoord en we hebben samen gesprekken met hulpverlening gevoerd. Nu woon ik op mezelf en voel me vredig en stabiel. Ik heb écht een nieuwe start gemaakt.” Lees meer over ons jongerenwerk
Make Your Mark
Wij geloven dat iedereen het vermogen heeft om een unieke stempel op het leven te drukken. “Make Your Mark” is meer dan een uitspraak; het is een uitnodiging om jouw talenten te ontdekken, veerkracht op te bouwen en jouw eigen weg te banen door de wereld.
Wij bieden geen standaard antwoorden, maar een platform voor jouw groei en zelfexpressie. Of het nu gaat om het ontwikkelen van nieuwe vaardigheden, het overwinnen van obstakels of het creëren van een blijvende indruk in de wereld; bij Link Jongerenwerk moedigen wij je aan om je eigen pad te bewandelen.
Ontdek de kracht van ‘Make Your Mark’ bij Link Jongerenwerk. Samen bouwen we aan een toekomst vol mogelijkheden en succes. Maak je eigen markering en laat zien wat jij in huis hebt!
Voel je welkom om samen met ons jouw stempel op het leven te drukken!

Onze projecten
Met creatieve oplossingen, innovatieve programma’s en een niet-aflatende toewijding, werken we onvermoeibaar om barrières te doorbreken en kansen te creëren. Bekijk hieronder onze projecten.